Table of Contents
Toggle1 · April 2 Shockwave: The “Every Country That Robs Us” Tariff Edict
1.1 The Announcement No One Believed Would Happen
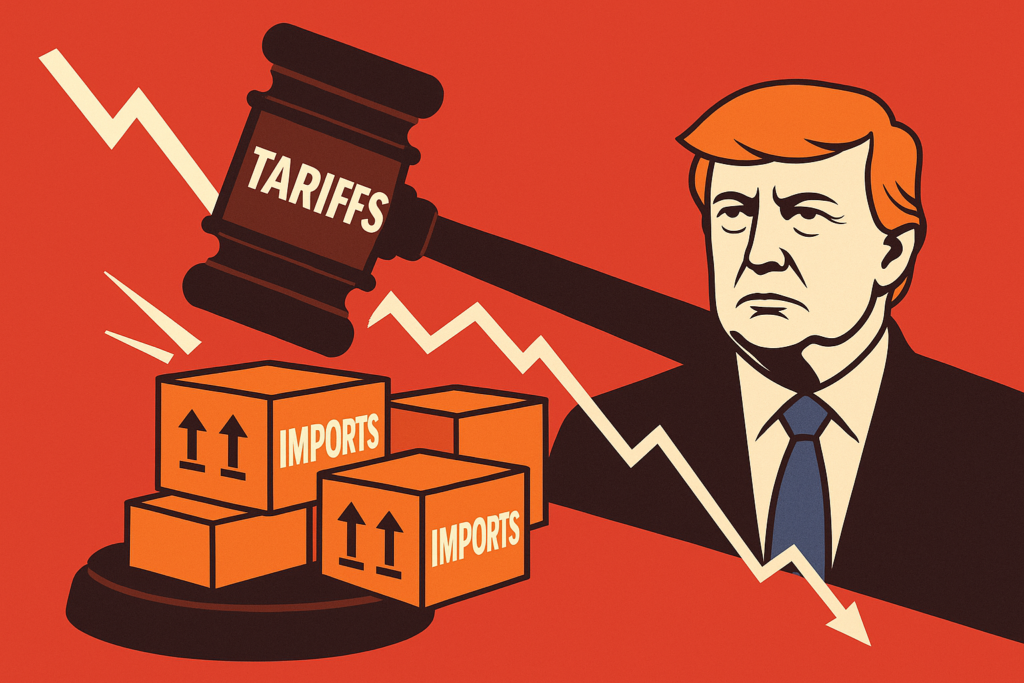
At 9:17 a.m. ET on April 2 2025, President Donald Trump held an unscheduled Rose Garden press conference. Flanked by steelworkers in hard hats, he declared a blanket 10 % tariff on all imported goods from “every country that robs us blind,” taking effect in 30 days. Until that moment, Wall Street consensus pegged any new tariffs at < 2 % and phased in gradually. This action started what most refer to “Trump Tariffs 2025”.
Instant market read: Within 60 seconds, E‑mini S&P 500 futures slipped 1.7 %; by the closing bell, the cash index had crashed 4.8 %, erasing $1.4 trillion in market cap.
Traders scrambled to digest the breadth: unlike 2018’s steel‑and‑aluminum levies, this order spared exactly no sector. Even snow globe imports from Switzerland? Taxed. Pharmaceutical precursors from Ireland? Taxed. Flat‑panel TVs assembled in Mexico? Taxed twice if components crossed two borders.
1.2 Why This Shock Felt Bigger Than 2018
- Size of U.S. imports today: Imports run 18 % of U.S. GDP versus 14 % in 2018. A flat 10 % tariff now touches roughly $3.2 trillion in goods—$320 billion in new annual duties.
- Supply‑chain complexity: Post‑pandemic near‑shoring is still partial. Many firms rely on multi‑border assemblies. Tariffs apply each leg, stacking duties and muddying margins.
- Debt‑heavy corporate balance sheets: Average S&P 500 net‑debt‑to‑EBITDA sits at 2.1× vs. 1.4× pre‑COVID. Firms have less cushion to absorb gross‑margin hits.
1.3 Intraday Tape Action — Anatomy of a Panic Sell‑Off
| Timestamp (ET) | S&P 500 Change | Notable Flow | Commentary |
|---|---|---|---|
| 9:17 | –0.9 % | Program sell algorithms spike | Headline first hits Bloomberg. |
| 9:35 | –2.3 % | VIX future vol ↑ 25 % | CTA funds accelerate de‑risking. |
| 11:00 | –3.6 % | $8 bn notional S&P put spread prints | Dealers widen bid‑ask spreads. |
| 1:45 | –4.1 % | NYSE short‑sale uptick rule triggers | Liquidity fractures in small caps. |
| Close | –4.8 % | $82 bn equity mutual fund outflows | Retail panic joins institutional flows. |
While the index cratered, certain defensive pockets—utilities, consumer staples—actually closed green. Hint #1 that sector dispersion would dominate the weeks ahead.
2 · Tariff Whiplash Timeline: One Month, Seven Pivots, $500 B in Market Cap Swings
Below is a day‑by‑day chronicle. Hover (or tap) on the annotated Figure 1 timeline in the live article to drill into each headline’s market impact. Trump Tariffs 2025
| Date | Headline | 1‑Day Move | Running S&P Drawdown |
| Apr 2 | 10 % blanket tariff | –4.8 % | –4.8 % |
| Apr 3 | China vows “comprehensive retaliation” | –4.4 % | –8.9 % |
| Apr 4 | EU threatens WTO case; yen rallies | –2.9 % | –11.5 % |
| Apr 5 | Trump hints “phase‑in if partners engage” | +2.4 % | –9.4 % |
| Apr 8 | Treasury floats 90‑day suspension for allies | +1.7 % | –7.9 % |
| Apr 9 | 90‑day pause formally announced | +9.5 % | –0.2 % |
| Apr 21 | Cine‑tariff: 20 % duties on foreign films | –1.6 % | –2.1 % |
| May 5 | Surprise 125 % tariff on Chinese EVs | –3.0 % | –5.0 % |
| May 7 | Hints of U.S.–China talks revive risk | +4.1 % | –1.1 % |
Figure 1: S&P 500 Timeline March 15 → May 7 with headline annotations. Markets weren’t reacting to macro data; they were reacting to the pace of presidential podiums. Trump Tariffs 2025
3 · Relief Rally Mechanics: Why +9.5 % in a Day Didn’t Fix Everything
When the White House carved out a 90‑day suspension for “strategic partners” on April 9, pundits called it a “capitulation rally.” In truth, the bounce masked a violent short‑covering cycle rather than fresh conviction buying.
- Dealer gamma flip: Put‑heavy dealer books were short delta and short gamma. A sudden +3 % futures gap pulled dealers into buy flows to stay hedged, turbo‑charging upside.
- CTA trend models: Five‑day reversal triggered buy signals across most managed‑futures funds, adding another ~$22 bn in forced buying.
- Retail FOMO: Robinhood net‑buys hit their highest single day since the 2021 meme‑stock mania. Yet survey data showed households withdrawing cash from equity mutual funds—a bifurcated retail picture. Trump Tariffs 2025
The S&P finished April down a mere 0.8 % despite a mid‑month peak drawdown of –12 %. Under the hood, however, sector dispersion reached a five‑year high: steel up double‑digits; autos in free‑fall; semis in no‑man’s‑land awaiting exemption details.Trump Tariffs 2025
4 · Winners & Losers: A Sector‑by‑Sector Autopsy
| Sector / Proxy ETF | Apr 1 Close → May 7 Close | Relative to S&P | Tariff Logic |
| Steel (SLX) | +11.0 % | +12.1 % | Blanket tariffs raise domestic prices; limited foreign supply. |
| Railroads (IYT) | +6.0 % | +7.1 % | On‑shoring drives raw‑material transport demand. |
| Utilities (XLU) | +3.8 % | +4.9 % | Bond proxies attract funds rotating out of cyclicals. |
| Autos (CARZ) | –18.1 % | –17.0 % | Auto OEMs import engines, electronics; EU mulls 30 % counter‑tariff. |
| Machinery (CAT) | –14.2 % | –13.1 % | 45 % ex‑US revenue; margin squeeze. |
| Semis (SOXX) | –6.3 % | –5.2 % | Smartphone/PC parts exempt after initial sell‑off. |
Highlight: Bank of America’s Sell downgrade on Illinois Tool Works (ITW) cited “uniquely vulnerable global footprint.” Shares fell 11 % that session, dragging industrials lower. Trump Tariffs 2025
Stock‑Specific Laggards & Rockets Trump Tariffs 2025
- Loser: General Motors (GM) –21 % YTD as China hinted a 25 % retaliatory levy specifically on U.S. SUVs.
- Winner: U.S. Steel (X) +28 % YTD on capacity‑utilization upgrade news.
- Wild card: Netflix (NFLX) lost 9 % on the “cine‑tariff” but regained ground when analyst notes flagged its large domestic content library.
5 · The Fed’s Tightrope: Inflation Risk vs. Growth Chill
5.1 Minutes That Moved Yields
The May 7 FOMC press conference became a live referendum on tariff fallout. Chair Powell warned that blanket duties could “feed short‑term price pressures while constraining real output”—code for stagflation risk. Trump Tariffs 2025
| Metric | Pre‑Tariff (Mar 30) | Post‑Tariff (May 7) |
| Core PCE YoY (est.) | 2.6 % | 2.9 % |
| Unemployment Rate | 3.8 % | 4.1 %* (Q3 est.) |
| 2s/10s Yield Spread | –15 bps | +48 bps |
*Estimate per Fed staff projections. Trump Tariffs 2025
Futures markets slashed the probability of a June rate cut to 20 %, down from 65 % before tariffs. Bank stocks liked the steeper curve; growth sectors hated the hawkish tilt.
5.2 What Could Make the Fed Blink
- Oil above $100/bbl: Would force a hawkish pivot to fight cost‑push inflation. Trump Tariffs 2025
- Consumer‑confidence collapse: University of Michigan sentiment already slid five points; another 10‑point drop could justify a dovish stance.
Takeaway: The Fed is now hostage to tariff headlines—every CPI print will be re‑priced through that lens.
6 · Global Ripple Effects
6.1 Asia — From Panic to Relief Rally
The MSCI Asia Pacific ex‑Japan index initially fell 6.7 %, wiping $580 bn of market value. Beijing’s hint at restarting trade talks on May 7 flipped the index +3 % in one day. Korean automakers remain deep in correction territory; Australian iron‑ore miners rallied on domestic U.S. steel demand.
6.2 Europe — Legal Battles and Targeted Duties
Brussels filed a WTO case 72 hours after the blanket tariff. Euro Stoxx 50 slipped 2 % MoM; EU officials floated retaliatory levies on U.S. bourbon, motorcycles, and denim. German carmakers lost a combined €38 bn in cap.
6.3 Cross‑Asset Snapshot
| Asset | Pre‑Tariff | May 7 Close | Move |
| Dollar Index (DXY) | 103.2 | 103.1 | Flat |
| Gold | $2 083/oz | $2 247/oz | +7.9 % |
| Brent Crude | $88/bbl | $92/bbl | +4.5 % |
FX markets stayed calm; equity volatility absorbed most of the tariff risk—so far.
7 · Investor Playbook: Positioning Amid Headline Risk
7.1 Defensive Rotations
- Domestic small‑caps: Less than 10 % foreign sales cushions tariff exposure.
- Utilities & regulated monopolies: Rate‑base pass‑through protects margins.
- 5–7 % Gold allocation: Historically offsets policy‑driven shocks.
7.2 Offensive Bets If Tariffs Stick
- Steelmakers (X, NUE): Beneficiaries of price uplift.
- Freight rails (UNP, CSX): On‑shoring boosts carloads.
- Infrastructure ETFs: Tariff revenue may fund reshoring projects.
7.3 Hedges
| Instrument | Purpose | Caveat |
| VIX call spreads | Capture volatility spikes | Theta decay |
| 0‑DTE S&P puts | Day‑of news hedge | Expensive when vol elevated |
| Long USDJPY | Risk‑off FX play | Works only if Fed stays hawkish |
8 · Key Forward Catalysts
| Date | Event | Market Sensitivity |
| May 11 | U.S.–China vice‑minister talks | Positive headlines could ignite squeeze; failure = new lows |
| May 29 | WTO preliminary ruling | EU win could embolden counter‑tariffs |
| June 12 | FOMC decision & SEP | Any hawkish surprise impacts growth stocks |
| July 8 | Tariff‑pause expiry | Binary for Q3 volatility |
| Aug 1–15 | Q2 earnings season peak | Margin guidance reveals real tariff bite |
9 · Bottom Line: Three Scenarios
| Scenario | Probability | S&P 500 Target | Signposts |
| Deal Lite | 40 % | 6 150 (+9 %) | Progress at Zurich talks; Fed neutral |
| Status Quo | 35 % | 5 400 (–6 %) | Pause expires quietly; limited retaliation |
| Escalation | 25 % | 4 900 (–15 %) | Talks fail; global PMI slide |
Whether you trade or invest, remember: tariff risk = headline risk × margin risk × policy lag. Size positions accordingly and keep powder dry for panic‑born opportunity.
Disclosures & Sources
Data: S&P Dow Jones Indices, Bloomberg, Reuters, Bank of America Global Research, Federal Reserve, WTO filings. The author holds no direct positions in securities mentioned. This content is for informational purposes only.
Feel free to read:


